Appearance
Monitors
Learn how to set up and manage monitors in Uptinio.
What is a Monitor?
A monitor (also called network monitor) is a tool that actively checks the health and status of your services or endpoints over the network. It performs regular automated checks to verify availability, response times, and proper functioning of your web applications, APIs, servers and other network resources. When issues are detected, monitors can trigger incidents to notify you through configured integrations.
Monitor Types
HTTP(s) URL
Checks website and API availability by making HTTP requests and verifying proper responses. Monitors response codes, request latency, SSL certificate validity, and tracks domain expiration dates.
PING
Uses ICMP ping to verify if a server is online and responding. Measures basic connectivity and latency to the target host.
TCP Port
Checks if specific network ports are open and accessible. Useful for monitoring services like databases, mail servers, or custom applications.
Heartbeat
A passive monitoring type where your system actively reports its status. Ideal for monitoring background jobs, cron tasks, or batch processes.
Keyword
Verifies webpage content by checking for specific keywords or phrases. Helps detect content changes and validates page integrity. An incident is created if the monitored keywords are missing from the webpage response.
Browser (UI)
Runs a script in a headless browser that mimics user actions: open a URL, then perform steps such as click, fill, wait for an element, or assert that specific text appears. Useful for monitoring JavaScript-heavy pages, login flows, or multi-step user journeys. Each run records success or failure and total journey time; failures create incidents like other monitor types.
Generate script from a flow (API)
You can auto-generate the browser script JSON from a URL and a short flow description. The API runs the script against the URL (up to 3 attempts, with LLM retries on failure) and only returns success when the script passes.
- Endpoint:
POST /api/v1/synthetic_monitoring/generate_script - Body:
{ "url": "https://example.com", "flow": "Open the page, click Login, fill email and password, then assert that Dashboard appears", "request_timeout": 30 }(request_timeoutoptional, 5–120 seconds, default 30) - Success:
{ "browser_script": [ { "action": "navigate", "url": "" }, ... ], "validated": true } - Failure (after 3 attempts):
{ "error": "assert_text: expected '...' not found", "validated": true }
Use the returned browser_script when creating or updating a Browser (UI) monitor. Requires project authentication (Bearer token).
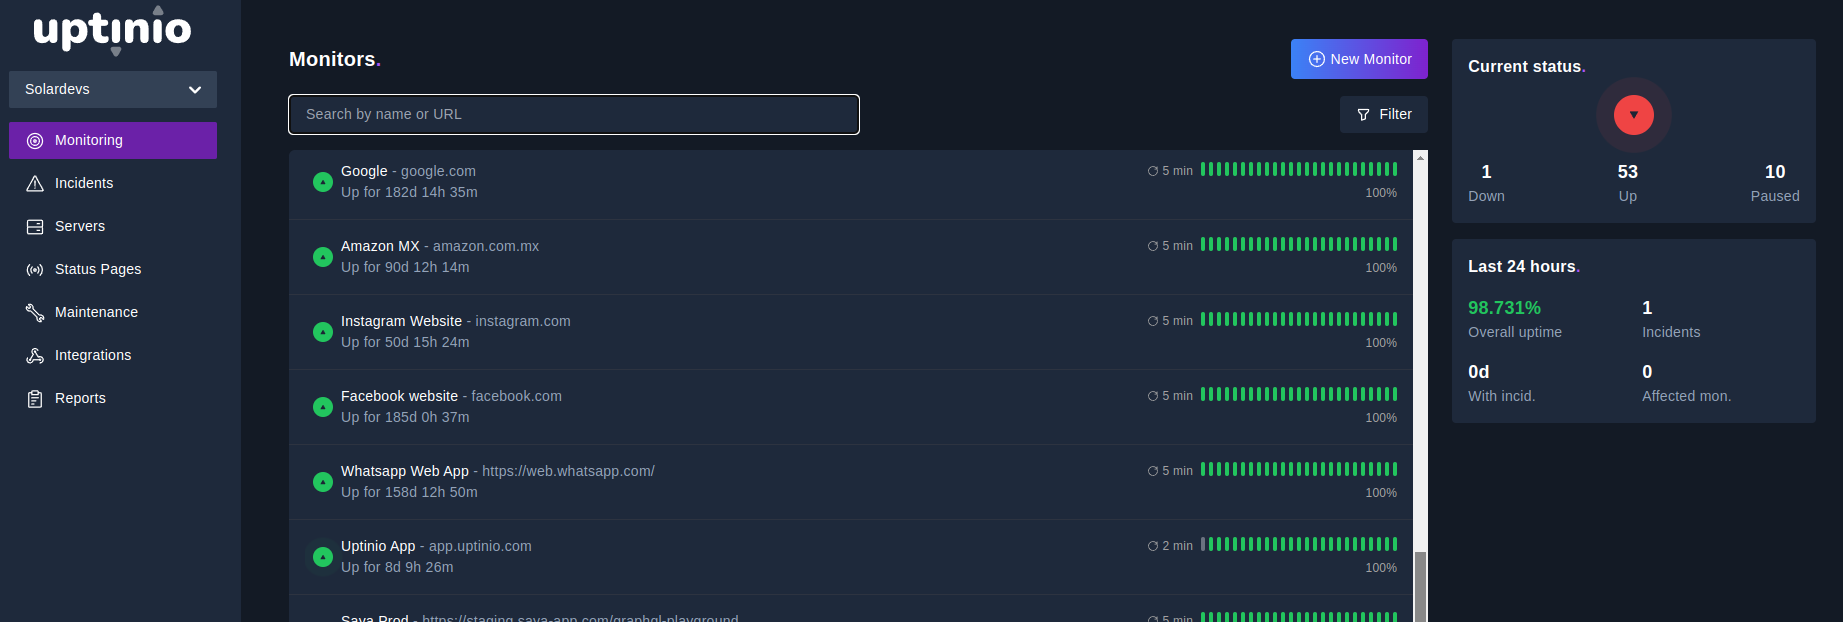
Creating a Monitor
- Go to the Monitors section in the dashboard.
- Click "New Monitor".
- Fill in the required details (name, type, target, integrations, etc).
- Save to start monitoring.
Parameters
Allowed parameters when creating monitors:
- Name: Descriptive name for the monitor
- URL/Target: The endpoint or service to monitor
- Check Type: HTTP(S), PING, TCP Port, Heartbeat, Keyword, or Browser (UI)
- Check Interval: How often to run checks (in minutes)
- Request Timeout: Maximum time to wait for response
- SSL Verification: Whether to check for SSL certificate errors
- Domain Expiry Reminders: Get notifications before domain expires
- Authentication:
- Type: Basic auth, token, etc.
- Username
- Password
- HTTP Method: HEAD, GET, POST, PUT, PATCH, DELETE. (default: HEAD)
- Request Body: Payload to send with request (for POST/PUT)
- Send as JSON: Whether to send request body as JSON data (adds Content-Type: application/json header)
- Integrations: Configure notification channels to receive alerts when failures occur
Managing Monitors
- Edit or delete monitors from the list.
- View uptime and response time metrics.
Best Practices
- Monitor all critical endpoints.
- Set up integrations for effective alerting.